For HR teams · Admin dashboard & analytics

The participation number, without the spreadsheet.

Every step, workout, logged meal, and mindful minute your employees record lands in one corporate wellness dashboard, as a single participation rate you can take to leadership.

Aggregate-only by design Trusted by 100+ organizations No PII in AI insights
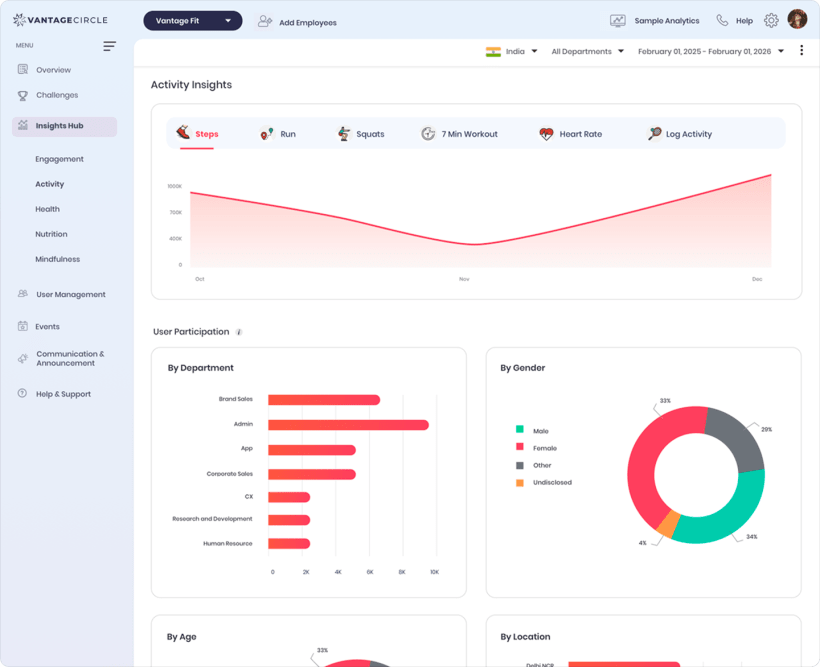
Vantage Fit admin analytics dashboard showing activity insights and participation broken down by department, gender, and location
Participation Rate
62%
Leadership Insights
AI-generated

The Overview, shown with sample data.

Trusted by 100+ organizations in 50+ countries TATA MOTORS WIPRO ACCENTURE TEVA TEXAS INSTRUMENTS HERSHEY BRAZOSPORT ISD
The Overview

Four numbers. One participation rate.

The dashboard opens on the four KPI cards leadership asks about, each with delta and sparkline.

Enrolled Users+4.1% vs prev quarter
2,418

Every employee invited into the program.

Active Users+6.8% vs prev quarter
1,496

Logging in the selected period.

Incentivization-2.3% vs prev quarter
$3,860

Rewards spend, SOLI-converted to your currency.

Participation Rate+5.2 pts vs prev quarter
62%

The number you take upstairs.

Slice it 7 days 30 days Quarter Year Custom range Country Department Age Group Gender

Figures are as of yesterday. Product UI shown with sample data.

Insights & next steps

Reads the dashboard, so you do not have to.

One panel interprets, one points. Neither touches your setup.

AI-generated · Aggregated buckets only · Read-only

Leadership Insights

Written observations for your leadership review, produced through an internal ML API from aggregated buckets only, never PII. Read-only: it does not predict, and it never changes your configuration.

Key Insights

Participation has climbed four straight quarters, but is still under target.

Focus Areas

One department has been inactive for 30+ days.
Rule-based · Links, not automations

Recommended Actions

Priority-ordered shortcuts, never more than five. Each is a link to the screen that fixes the problem, not an automation running behind your back.

System suggested next steps

  • View Inactive Employees92 users inactive for 30+ days→
  • Nudge Inactive UsersRe-engage the quiet segment→
  • View Wellness LeaguesStandings across the season→
At a Glance · This month

The habits behind the number.

Four everyday metrics with sparkline and trend, so a dip in participation never arrives unexplained.

Avg Steps 8,432 /day +3.1% vs last month
Active Minutes 42 min/day +5.4% vs last month
Mindful Minutes 11 min/day -1.8% vs last month
Avg Sleep 6 hr 48 mins +0.6% vs last month

Every metric is an aggregate across the group you have filtered, never a person.

Reports & exports

Board-ready exports, no assembly required.

Every report exports to CSV from the same console, filters applied before export.

Employee Report CSV

Active, inactive, and dormant employees, with search and filters.

Challenge Leaderboard CSV

Standings per challenge, ready for the recap deck.

Transaction Report CSV

Points and rewards, SOLI-converted, with date and category filters.

Redemption Report CSV

What employees redeemed, and when.

League Report Annual plan

League movement and standings across the season.

Certificates PDF

Automated for every completed campaign, branded and ready to send.

Privacy by design

Aggregate only. Never a person.

Admins see counts, rates, and trends. The dashboard has no screen that shows an individual employee's health data.

  • No individual weight, BMI, or health risk assessment is visible to HR.
  • Leadership Insights run on aggregated buckets; no PII is sent to the ML API.
  • HIPAA-guideline aligned on health data handling.
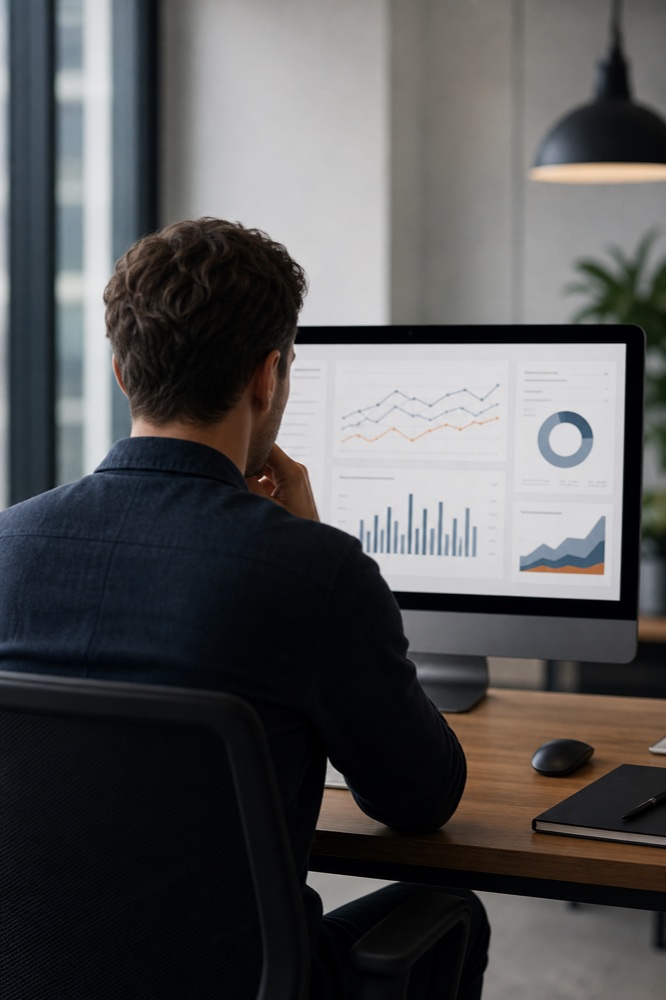
An HR professional reviewing aggregated program analytics on a laptop
Seen in a real program

What a measured campaign looks like.

86% employee engagement in Fit Wars, a two-week challenge, May 2024
“It's a great way to log activities. Employees are also rewarded with points, recognition and prizes.”
Rachel Arthur
Rachel ArthurDirector of Benefits & Wellness, Brazosport ISD · Fit Wars campaign, May 2024

Rollout questions HR asks first

Can I see a specific employee's health data?

No. Individual weight, BMI, and health assessment results are never exposed to HR. Every surface in the admin dashboard shows counts, rates, and trends across groups, never a person's health profile.

Which parts are tied to an annual plan?

Wellness Leagues and the League Report are annual-plan surfaces; other tiers see them grayscale-locked with Contact Account Manager. KPI cards, filters, Recommended Actions, certificates, and the Employee, Transaction, and Redemption reports are standard.

Do the AI insights change anything in my program?

No. Leadership Insights are read-only observations from aggregated data. Acting on them is your call, usually through a Recommended Action link.

See your participation number.

We will open the Overview on a program like yours and walk the KPI cards, insights, and reports with you.

Aggregate-only analytics Trusted by 100+ organizations CSV exports from day one No obligation
Turn participation into progress.